
FOR HOTELS, RESORTS & GROUPS
Revenue and occupancy reports
Review booking revenue and occupancy for a selected period. Compare room types and previous periods using the reservation records in OpenStays.
No setup fee. No commission.
ILLUSTRATIVE FEATURE OVERVIEW
Reporting view
Revenue
Review the value of your reservations
Occupancy
See how your available nights are used
Booking trends
Compare the periods that matter to you
Property decisions
Use your records to guide the next step
Understand your booking picture
What happens without a proper revenue report
Use recorded bookings and payment statuses to understand the period. Reconcile bank settlements separately against your bank and payment provider statements.
Most properties can say whether business feels good this week. Far fewer can say, with a number they would defend, whether last month actually beat the month before it, because that answer does not live in one place. It is split across a booking list, a payments app and whatever the owner remembers checking.
A live dashboard is built to answer a different question, what does today look like, not what did last month add up to. Nobody opens a real time view in February to work out how January went, room type by room type and few dashboards are built to answer that question even if someone tried.
So the job usually falls to whoever is willing to rebuild it by hand. Most months that means the owner, at the end of the month, going through the booking list line by line and matching it against whatever the bank statement shows. It takes an evening when nothing is wrong, longer when something does not add up and it is exactly the kind of task that gets pushed to next week the moment anything more urgent comes up, which on a working property is most weeks.
The problem compounds once a manager or accountant needs the same numbers. Without one report both can point to, each ends up with a slightly different version, one counting a refund the other missed, one working from a different date range and small disagreements about the numbers turn into long conversations that were never really about the numbers at all.
None of this is anyone’s fault. Booking software is generally built to help take and manage a reservation, not to answer a month end question about what that reservation was actually worth once fees, refunds and a partial cancellation are accounted for. That gap has to be closed somewhere and for most properties it currently gets closed manually, one spreadsheet at a time.
The scale of the gap is easy to underestimate until it is written down. A property with sixty bookings in a month, across several room types, two payment methods and a handful of refunds, has enough moving pieces that reconstructing it by memory is genuinely unreliable, not just inconvenient. Nobody is bad at this task, the task itself is not one memory was built to do well.
What guessing at the numbers actually costs
The most immediate cost is time. Rebuilding a month of revenue and occupancy by hand from a booking list is not a five minute task and it is time spent on data entry rather than anything that grows the property, at exactly the point in the month when that time is usually already scarce.
There is a decision making cost that is harder to see. Without reliable revenue and occupancy reports, pricing decisions end up based on gut feeling rather than an actual comparison, was the new weekend rate a good call, did the festival pricing rule earn more than it cost in lower occupancy. Those are answerable questions, but only with numbers that can actually be trusted.
There is a payout cost too. Money collected through an online booking rarely reaches a bank account as a single clean transfer, gateway fees, refunds and adjustments all shave a little off and without a report that reconciles gross revenue against what actually landed, a shortfall can sit unnoticed for months. By the time it is spotted by accident, the paper trail needed to dispute it is often gone.
There is a tax and accounting cost. A GST filing, an income statement, or a bank loan application usually needs a clean revenue figure for a specific period, not a rough estimate from memory. Producing that figure at the last minute, under deadline pressure, is a worse experience than having it ready on demand.
There is a cost to the owner personally as well, less obvious but real. Reconstructing last month’s numbers by hand at eleven at night after a full day of running the property is not a rare inconvenience, for many owners it is a monthly ritual and it eats into exactly the time that should be going toward decisions, rest, or family, rather than data entry a system should have been keeping all along.
There is also a comparison cost that only shows up over time. Without consistent revenue and occupancy reports, this March is never properly measured against last March, so a genuinely good or bad season can pass without the property learning anything reusable from it. A rate that worked well during a festival week two years ago is easy to forget entirely and a mistake that cost real revenue can quietly repeat itself the following year, because nothing kept a clear enough record to recognise it happening again.
None of this shows up as one dramatic loss. It shows up as a slow tax on attention, a pricing call made on instinct that a report would have corrected, a payout gap nobody caught and an evening spent rebuilding a spreadsheet instead of doing anything else.
What revenue and occupancy reports actually give you
Revenue and occupancy reports summarise the reservations and recorded payment information for your selected period. Use them to review booked revenue, occupied nights and room performance. They do not automatically verify what reached your bank account.
Four numbers sit at the top of every report: total revenue for the period, occupancy as a percentage of available room nights, average daily rate and revenue per available room, the number that combines how full the property was with how much each night actually sold for. Each one is shown next to the same figure from the period before, so a good or bad month is immediately obvious rather than something that has to be worked out separately.
Below that sits a monthly trend, so the current period is never read in isolation. A strong July only means something once it is visible against a slower April and a busier December and a report that only ever shows the current period misses exactly the comparison an owner actually needs.
The same numbers are broken down by room type, so it is clear which rooms are actually earning their keep. A property with several room types can see that the lake view rooms are running near ninety percent occupancy while the standard rooms sit closer to sixty, a decision-relevant fact a single blended occupancy number hides completely.
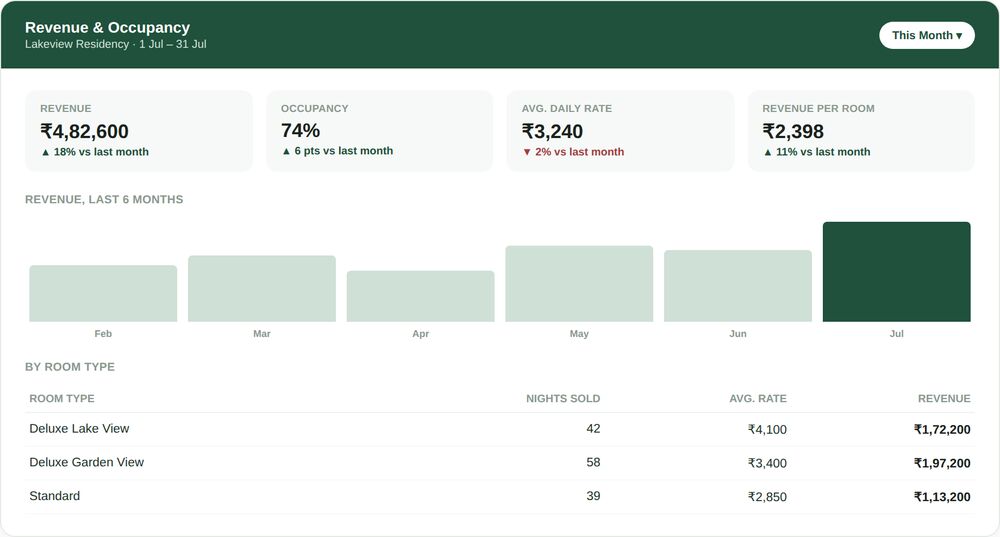
Revenue and occupancy for the month, compared against last month, broken down by room type.
Every number here is drawn from the same underlying booking data the reservations dashboard already uses, so a report and a dashboard checked on the same day never quietly disagree with each other.
None of this asks the owner to define anything up front. Room types, rates and payment methods are already set up elsewhere in the account and these reports simply read from that same configuration every time a period is generated, so there is no separate setup step and nothing that can quietly drift out of sync with how the property is actually run.
What is actually in a revenue and occupancy report
Revenue at a glance
Total revenue, average daily rate and revenue per available room for any period, shown next to the same numbers from the period before so a good month is obvious without having to calculate it.
Occupancy that means something
Occupancy shown as a percentage of available room nights, not just a room count and broken down by room type so it is clear which rooms are actually filling up and which are not.
Review received payments
Compare recorded payments with your bank and payment provider statements. Check gateway fees, refunds and settlement adjustments separately before treating booked revenue as money received.
Exportable, on demand
Any period can be downloaded as a spreadsheet in a few seconds, ready for an accountant, a GST filing, or a loan application, without rebuilding it from the booking list by hand.
SEE IT IN ACTION
Review revenue and received payments
In this illustrative example, a resort owner reviews July’s booked revenue and occupancy, then compares recorded payments with the gateway settlement statement and bank credits. These are separate checks.
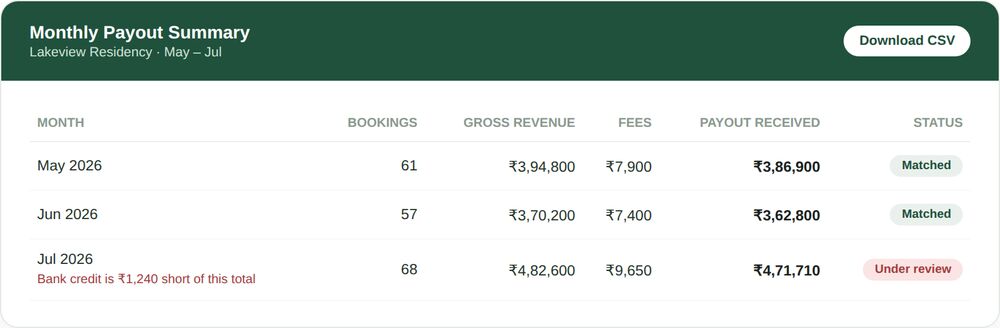
Illustrative workflow: the owner checks payment provider statements and bank credits separately.
If the bank credit differs from the expected settlement, the owner checks the provider’s fees, refunds and adjustments before raising a query. OpenStays booking records provide context. An automatic bank reconciliation alert is not implied.
Because the report flags it the moment the numbers are pulled, the owner catches it within the first ten minutes of the month, not three months later while doing annual tax preparation, by which point the specific transaction would have been far harder to trace. A short email to the payment provider, with the exact booking dates and amounts already laid out by the report, resolves it within a few days.
The same report also shows something more encouraging. Revenue is up eighteen percent on June and the six month trend makes clear this is not a one month blip, it follows a steady climb since April. Occupancy for the Deluxe Lake View rooms is running well ahead of the Standard rooms, a fact the owner uses the following week to shift a little more of the marketing budget toward the room type that is clearly earning it.
The booking report gives the owner a starting point for review. Bank reconciliation still requires the relevant statements and a check by the owner or accountant.
A group operating several properties can use a consistent reporting period and format to review recorded revenue and occupancy. Its accountant still reconciles each property’s actual settlements separately.
Mistakes properties make without a real revenue report
- Rebuilding last month’s numbers from the booking list by hand every month, instead of having a report generate them automatically.
- Trusting the dashboard’s real time snapshot as if it were a historical record, when it is built to show today, not a comparison across months.
- Never actually checking that a payout matches what was earned, so a gateway fee error or a short credit goes unnoticed indefinitely.
- Making pricing decisions on instinct alone, because there is no reliable revenue and occupancy report to check whether last season’s rate change actually paid off.
- Scrambling to produce a clean revenue figure at tax filing time, instead of having one ready on demand for any period.
- Treating occupancy as a single blended number, missing that some room types are running near full while others sit half empty.
- Losing the ability to explain a specific month’s numbers to a co-owner, investor or lender, because the only record was a mental impression rather than an exportable report.
- Assuming a payout that looks roughly right is right, without ever checking the specific numbers against what was actually earned.
- Keeping revenue records in a format that changes slightly every month, so comparisons quietly stop being apples to apples without anyone noticing.
None of these come from carelessness. They come from treating month end reporting as a task to survive rather than a habit worth building properly, something rebuilt from scratch under time pressure instead of something that already exists the moment it is needed.
The same numbers, whichever period or property you are checking
Revenue and occupancy reports for last month should use exactly the same definitions as one for last week, or for the same month a year ago, occupancy calculated the same way, revenue counted the same way, refunds handled the same way every time. Reports that quietly change their own math between periods are harder to trust than no report at all.
For a group running more than one property, the same report structure rolls up into a combined view without losing the ability to look at any single property on its own. A group owner can see the portfolio’s total revenue for the month, then drop into any one property to see exactly what drove it, without switching between two differently built systems to do so.
This consistency is what actually makes a report useful for comparison. A number that means one thing in March and something subtly different in April is not a number anyone can plan around and the entire value of revenue and occupancy reports depends on being able to trust that this month’s ninety percent occupancy means the same thing as last month’s eighty five percent.
This also protects against a subtler failure mode, a report that looks trustworthy but silently changes its own rules. A dashboard that counts a same-day cancellation differently in June than it did in January, without saying so, produces numbers that are internally consistent with nothing, including themselves. Reports built on one fixed set of definitions avoid that failure entirely, because the same booking, refunded the same way, always lands in the same place in the numbers, whichever month it happens to fall in.
Who actually opens these reports
An owner can review the report monthly to see which room types are performing well. Check the provider’s settlements and bank credits alongside it when reviewing money received.
A manager running day to day operations checks it less often but more specifically, usually after a pricing change, to see whether occupancy held up or dropped once the new rate went live. That specific comparison is hard to make with anything less structured than a proper report.
An accountant or a lender reviewing the property from outside cares about a different thing entirely, a clean, exportable number for a defined period that does not need to be reconstructed or explained line by line before it can be trusted.
How this fits with the rest of OpenStays
The reservations dashboard already shows revenue and occupancy at a glance, today’s booked revenue and the coming week’s occupancy, built to be read in five seconds during a busy shift. Revenue and occupancy reports are built for a different moment, sitting down at the end of a week or month to actually understand it, with recorded booking figures extended into period comparisons and room performance.
Reports use the booking and payment records recorded in OpenStays. Keep reservations and manual payment statuses current. Use staff roles to control access and review each property’s records when using multi-property management. Your bank and payment provider remain the sources for settlement reconciliation.
Revenue and occupancy reports vs. The alternatives
Most properties compare this against whatever they currently do to work out how a month went, usually a manual spreadsheet rebuilt from the booking list, or simply checking the bank balance and trusting that whatever landed is roughly right.
| A manual spreadsheet | Checking the bank balance | OpenStays | |
|---|---|---|---|
| Ready without rebuilding it | No, redone from scratch each month | N/A, no breakdown exists | Yes, generated automatically |
| Checks actual bank settlement | Manual comparison required | Shows credits without booking context | Compare separately with provider and bank statements |
| Breaks revenue down by room type | Rarely, most spreadsheets stay blended | No | Yes, every period |
| Comparable month to month | Only if the format never changes | No | Yes, same definitions every time |
| Time to produce for a given month | An hour or more, done by hand | A few minutes, but tells you little | Seconds, already calculated |
GETTING STARTED
Reading revenue and occupancy reports
How to read and use revenue and occupancy reports on OpenStays.
1. Open the report for the period you need
From the dashboard, choose a week, month or custom date range to generate a revenue and occupancy report for that period.
2. Check the headline numbers first
Look at total revenue, occupancy, average daily rate and revenue per room against the previous period, before going into any detail.
3. Review the room type breakdown
See which room types are driving revenue and which are underperforming, to inform the next pricing or marketing decision.
4. Check received payments separately
Compare expected payments with the provider’s settlement statement and your bank credits. Account for fees, refunds and adjustments before following up on a difference.
5. Export it if it is needed elsewhere
Download the report as a spreadsheet for an accountant, a GST filing, a co-owner update, or a loan application.
What to check in any revenue reporting system
- Does the report cover a full period, a week or month, not just a real time snapshot of right now?
- Is occupancy shown as a genuine percentage of available room nights, not just a raw booking count?
- Does it distinguish booked revenue from recorded payments and explain how to check actual bank settlements?
- Can revenue be broken down by room type, not just shown as one blended number for the whole property?
- Can a specific period be exported as a spreadsheet without rebuilding it by hand?
- Does the report use the same definitions every time, so one month is genuinely comparable to another?
- Does the system make it obvious which numbers are estimates and which are exact, rather than presenting both with the same confidence?
A system that cannot answer these clearly is asking an owner to keep trusting a number nobody has actually checked.
It is also worth asking who inside the property can actually see this level of financial detail. A report that exposes full recorded payment and revenue figures to every login on the account is solving one problem while creating another, the same reasoning that keeps staff logins with roles limiting full financial visibility to the owner by default.
What is actually inside revenue and occupancy reports
Revenue is counted the way it is actually earned, the full booking value, minus anything refunded or cancelled, for the date range selected, against the date of the stay rather than the date the booking was made. A booking made in March for a July stay counts toward July’s revenue, not March’s, which matters for anyone trying to understand seasonality accurately.
Occupancy is calculated as room nights sold divided by room nights available for the period, accounting for the actual number of rooms in inventory, not a rough guess. A five room property that sells eighteen room nights in a thirty day month is at twelve percent occupancy, not eighteen bookings out of some unclear total.
Average daily rate divides total room revenue by room nights sold and revenue per available room divides the same revenue by total room nights available, whether sold or not. The two numbers together tell a fuller story than either alone, a high rate on a mostly empty property and a lower rate on a mostly full one can land at a similar revenue per room and the report shows both so that distinction is not lost.
Booking revenue and bank settlements measure different things. Recorded revenue describes reservations, while bank statements show received funds after settlement timing and provider deductions. Reconcile those figures separately.
Refunds and partial cancellations are handled the same way regardless of when they happen relative to the stay. A booking cancelled with a partial refund three weeks before arrival still counts, net of that refund, against the month the stay was scheduled for, not the month the cancellation happened, which keeps a cancellation heavy month from distorting an otherwise ordinary one.
Multiple payment methods are combined into one number rather than reported separately by default. A guest who paid partly through a direct UPI transfer and partly through a card at check-in shows up as one booking with one total, with the underlying payment method breakdown still available for anyone who needs that level of detail specifically.
None of this requires touching a formula or building a spreadsheet. It is generated automatically the moment the period is selected, from the same booking and payment data already flowing through the account for every reservation.
Frequently asked questions
What period can a revenue and occupancy report cover?
Any period: last week, last month, last quarter, or a custom date range chosen directly.
Does the report update in real time or only at month end?
It is generated on demand for any period, including the current month in progress, so it does not need to wait until the month closes.
How is occupancy calculated?
Room nights sold divided by room nights available for the selected period, based on the property’s actual room count.
What counts as revenue, the booking date or the stay date?
Revenue is counted against the stay date, not the date the booking was made, so seasonality is reflected accurately.
Can I break revenue down by room type?
Yes, every report includes a room type breakdown showing nights sold, average rate and revenue for each.
Does the report reconcile payouts automatically?
No automatic bank reconciliation is claimed here. Review recorded payment statuses in OpenStays and compare them with the provider’s settlement statement and your bank credits.
What happens if a payout does not match?
Check the payment reference, settlement date, fees, refunds and adjustments in your provider’s records. Contact the provider or bank about any unexplained difference.
Can I export the report?
Yes, any period can be downloaded as a spreadsheet, ready for an accountant, a GST filing or a loan application.
Who can see the full revenue and occupancy report?
By default, the Owner role sees full revenue and recorded payment detail and a Manager sees enough to run the property without full financial detail, under staff logins with roles.
Does this work for a property with multiple room types?
Yes, the breakdown by room type is included automatically for any property with more than one room type set up.
Can I compare this month against the same month last year?
Yes, any two periods can be compared directly, including year over year.
Does the report include cancellations and refunds?
Yes, cancellations and refunds are reflected in the revenue figures for the period they affected, not hidden from the total.
Is there a separate report for each property in a group?
Yes, a group account sees both a combined portfolio view and the ability to open any single property’s report on its own.
How far back does the reporting history go?
Reporting history goes back to the property’s first booking on OpenStays, so a full year or more of comparison is available as the account matures.
Does the report account for payment gateway fees?
Check the gateway’s fee and settlement statement for actual deductions. Do not assume the booking revenue figure is the amount received in your bank account.
Can I share a report with a co-owner or accountant who does not use OpenStays daily?
Yes, an exported report can be shared as a spreadsheet with anyone who needs it, without giving them full account access.
What changes in the first month
Start by comparing booked revenue and occupancy with what you expected for the period. Keep recorded bookings and payment statuses complete so the report provides a useful basis for review.
The first genuinely useful moment usually comes at the end of the first full month, when there is finally a previous period to compare against. A single month of data tells you what happened, two months start to tell you whether it is a trend.
Gateway fees and settlement delays can make received funds differ from booking revenue. Review the provider’s statements and bank credits separately, particularly when refunds or adjustments are involved.
Make a regular habit of reviewing the report, comparing periods and separately reconciling settlements. Use the results to decide whether rates, room allocation or booking follow-ups need attention.
Reporting history depends on the records available in your account. Do not assume OpenStays can reconstruct earlier reservations or bank settlements that were never recorded.
Owners who make the switch usually describe the same shift: less time spent reconstructing what already happened and more time spent deciding what to do about it, a rate to adjust, a room type to promote, a payout question worth a short email before it becomes a bigger one.
See exactly what your property made, every month
No setup fee, no commission. Your first revenue and occupancy report is ready the moment your first booking is.